
What Happens When You Ask Claude Code to Backtest Trend Following on Real Stocks?

Good morning!
Today let’s make the backtest.
The trading idea you have been meaning to test properly is probably already losing to doing nothing, and you will not find that out until you build a test that is allowed to say so.
Mine is trend following on individual stocks.
I have run a version of it for years and never sat down and checked it against the boring alternative. On Wednesday afternoon I asked Claude Code to check it, and it came back with this.
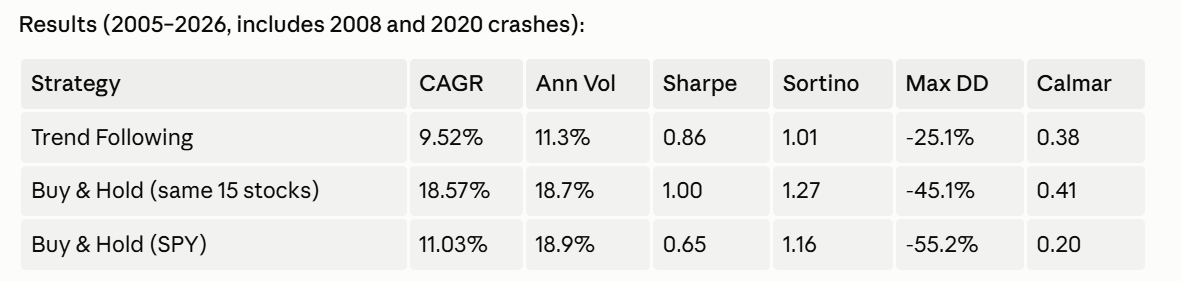
Trend following made 9.52% a year. Holding the same fifteen stocks and doing nothing made 18.57%. Over twenty one years that gap is not a rounding error, it is the difference between roughly seven times your money and roughly thirty times your money.
The rule cut the worst drawdown from 45% to 25% and charged nine points of annual return for it.
That is the headline result, and the interesting part is not the number. It is that the backtest was built in a way that let the number come out against me. Most of the time when someone asks an AI to test a strategy, it does not.
The instruction that came before “build it”
So I did not ask for a backtest. I asked for a literature/research review and then a backtest. That ordering is the only reason the rest of this is worth reading.
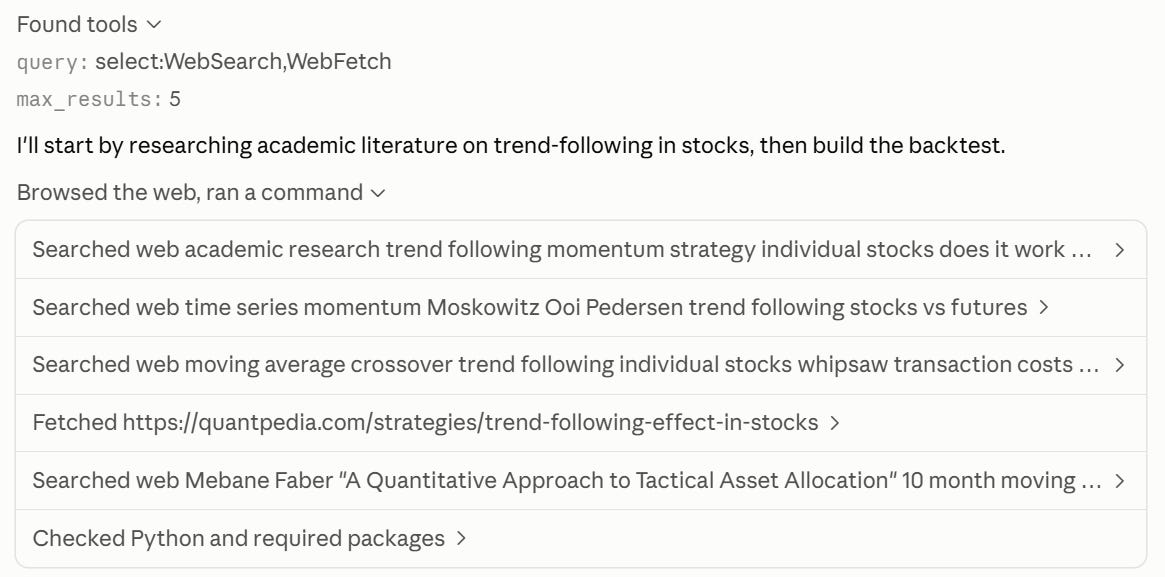
It pulled four sources and reported back what they agree on.
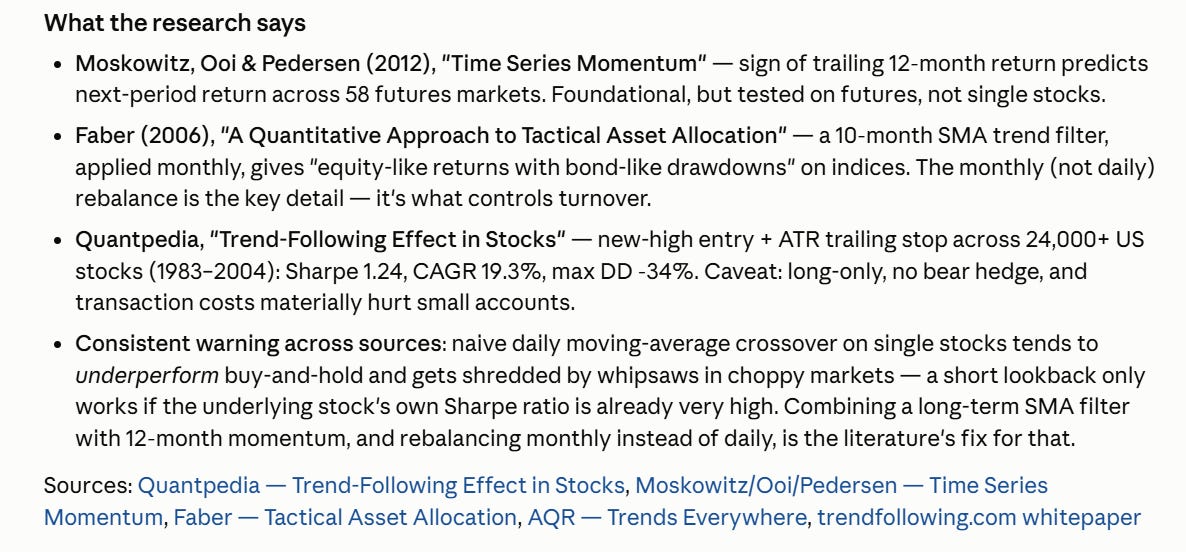
The useful content of that summary, in plain terms:
Moskowitz, Ooi and Pedersen (2012) found that the sign of the trailing 12 month return predicts the next period across 58 futures markets. Foundational, but it was tested on futures, not on single stocks.
SetupAlpha (2026) ranked 20 trend based regime filters over 2,700 backtests on SPY, QQQ and Bitcoin, 2000 to 2026. A trend filter charges between 2 and 4 points of annual return for the protection it gives, and one that dodges 86% of the COVID crash can still walk straight into the next bear market.
Faber (2006) got equity-like returns with bond-like drawdowns from a 10 month moving average applied monthly. The monthly rebalance is the part people skip, and it is what controls turnover.
Quantpedia reports Sharpe 1.24 and 19.3% CAGR for new-high entries with an ATR trailing stop across 24,000 US stocks, with the caveat that transaction costs hurt small accounts badly.
The warning all five share is that a naive daily moving average crossover on single stocks tends to underperform buy and hold and gets destroyed by whipsaws in choppy markets.
Yep, that last point is the whole reason to make the AI read first. Left alone, an AI writes the naive version, a 50 day crossing a 200 day on daily bars, because that is what the internet is full of. The papers have been saying since 2006 that this specific version does not work on individual stocks.
So the strategy that got built was not the one I would have got from a cold prompt. That matters more than any single setting in it.
What it built
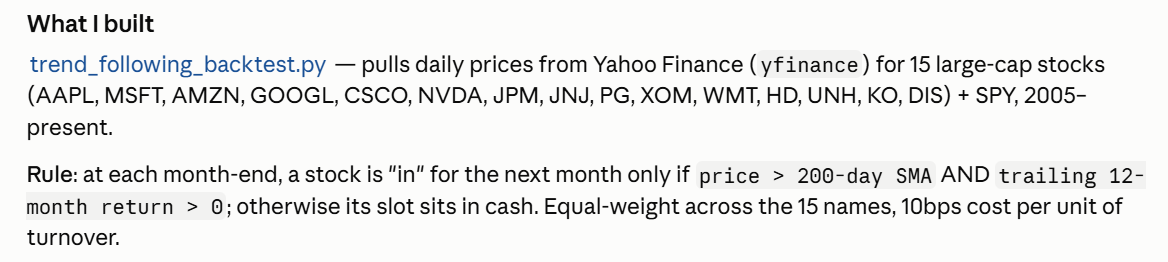
The rule is small enough to state in one breath. At each month end, a stock is held for the next month only if price is above its 200 day moving average and its trailing 12 month return is positive. Otherwise that slot sits in cash. Fifteen names, equal weight, 10 basis points of cost per unit of turnover.
Two things in there came straight out of the research step:
The 12 month momentum condition on top of the moving average, which is the literature’s fix for whipsaw.
The monthly decision instead of a daily one, which is what keeps turnover and cost survivable.
The cost assumption is the one I would argue with, and I will come back to it. First, what the equity curve looks like.
Where the strategy actually earns something
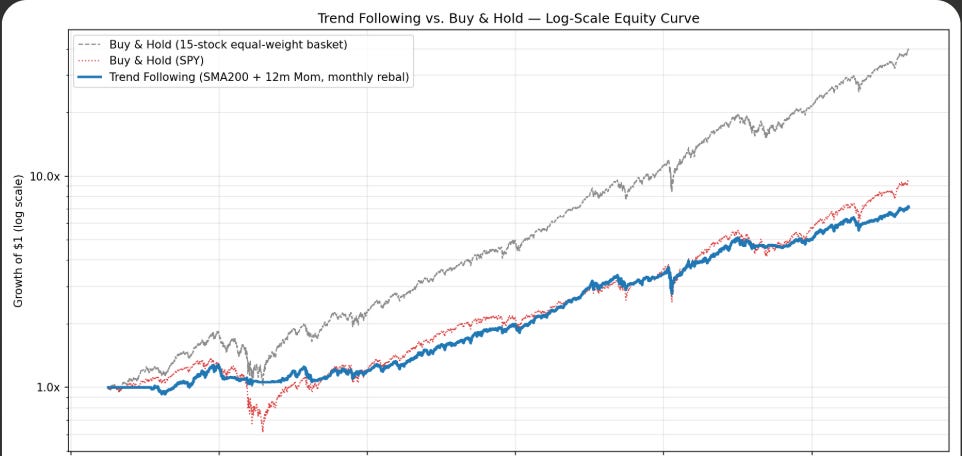
The grey line is the fifteen stock basket held and never touched. It is above everything else for almost the entire period. The blue line, the trend following version, tracks SPY closely and finishes slightly behind it.
On returns alone the idea is dead. Then you look at the second chart.

2008 is where the blue line separates. Buy and hold goes to roughly 45% down and SPY past 55%. The trend version flattens out around 20% and sits there. The same shape repeats in 2020 and again through 2022, smaller each time but always the same direction.
That is what the strategy is actually doing. It is not producing return, it is refusing to participate in the worst part of a decline.
The benchmark is not honest, and that changes the verdict
Here is the thing the results table does not tell you on its own. The fifteen stocks are AAPL, MSFT, AMZN, GOOGL, CSCO, NVDA, JPM, JNJ, PG, XOM, WMT, HD, UNH, KO and DIS. That list was written in 2026.
Nobody held an equal weight basket of those fifteen names from 2005 and left it alone. To do that you had to know in 2005 which of them would still be standing, and you had to hold NVDA through an 85% drawdown without touching it. The 18.57% is a number that only exists in hindsight.
SPY is the honest comparison, because SPY is the thing anyone could have bought in 2005 and held. Against SPY the same table reads differently:
CAGR 9.52% against 11.03%, so the trend version still loses on return, by 1.5 points rather than nine.
Sharpe 0.86 against 0.65.
Max drawdown 25.1% against 55.2%.
Calmar 0.38 against 0.20, meaning roughly twice the return per unit of worst-case pain.
Against the basket chosen with hindsight it lost badly. Against the index anyone could have actually bought it lost slightly on return and won every risk column.
Both readings come from the same run. Which one you get depends entirely on what you told the AI to compare against, and that is a choice most people make without noticing they made it. The habit of writing down the target before the prompt, rather than after seeing the output, is the one thing that separates a test from a demo, and it is the core of the AI trading workflow that is going viral right now.
Where this leaves the idea
I am keeping the rule, and I am no longer describing it as a way to make more money. It is a way to hold the same exposure through a decade without seeing half the account disappear, and it costs a point and a half a year against SPY to do that.
That is a decision, not a discovery. What is worth copying is not the strategy, it is the shape of the request that produced a test able to disagree with me. There are four parts to it and one of them is doing most of the work.